
[Messenger Load-Testing, Part 2] There Was a Deadlock Hiding in AI-Generated Code — How We Replaced `unreadCount` with `lastReadAt`
42.8% HTTP error rate, 9 minutes into a load test, at 12% of the target TPS. The culprit was a single updateMany line written during AI-assisted coding.
On this page
- Introduction
- 1 Discovery
“Why are we doing 9.5 TPS when the target is 75?”
- 2 The Real Culprit
40P01 deadlock detected
- 3 Code Audit
Wait, We Do 4–5 Writes Per Message?
Direct Evidence From the PG Log - 4 Honest Confession
This Was an Embarrassing AI-Coding Mistake
- 5 Prescriptions on the Table
How Far Should We Go?
- 6 What We Picked
- 7 Migration
Switching Reads, Removing Bulk Writes, and Cleaning Up the Column
Separating verified results from validation targets - Follow-up: Moving FCM Delivery to a Worker Queue
- Conclusion
Introduction
NOTE
42.8% HTTP error rate, 9 minutes into a load test. The culprit was a single updateMany line carelessly written during AI-assisted coding.
With the load-test environment from Part 1 now in place, it was finally time to measure how many TPS the send API could actually survive. The target was a modest 75 TPS of chat traffic. The moment the test started, the numbers fell apart — and this post is the story of tracking down why.
1. Discovery — “Why are we doing 9.5 TPS when the target is 75?”
We ran k6 against a load-test environment, targeting 75 TPS of chat traffic. The numbers came back ugly.
| Metric | Value |
|---|---|
| Target TPS | 75 req/s |
| Achieved TPS | 9.5 req/s (12% of target) |
| HTTP error rate | 42.8% |
| HTTP 5xx | 4.07 req/s |
| Postgres active connections | 11 / 27 max — plenty of headroom |
| Centrifugo publish failures | 0 |
The first suspect was always going to be connection pool exhaustion. But Postgres was only using 11 of 27 connections, and Centrifugo publish was 100% successful. Every signal pointed at the app server’s database queries themselves.
2. The Real Culprit — 40P01 deadlock detected
docker logs witim-web showed all the 5xx lines in identical shape:
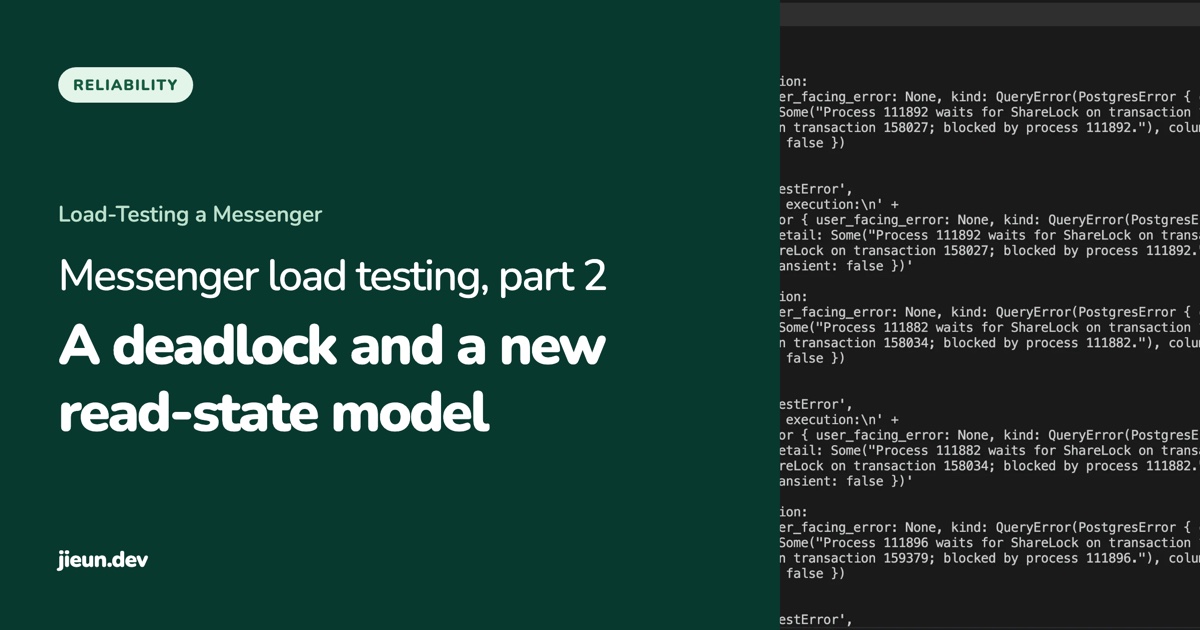
prisma:errorError occurred during query execution:ConnectorError(... QueryError(PostgresError { code: "40P01", message: "deadlock detected", severity: "ERROR", detail: Some("Process 111892 waits for ShareLock on transaction 158028; blocked by process 111881. Process 111881 waits for ShareLock on transaction 158027; blocked by process 111892.")}))Not P2024 (pool timeout). Not ETIMEDOUT. Pure PostgreSQL row-lock deadlock. Sixteen concurrent transactions were locking the same set of rows in different orders and crashing into each other.
3. Code Audit — Wait, We Do 4–5 Writes Per Message?
The offending handler, POST /api/channels/[id]/messages, was doing four to five serial writes with no transaction wrapper:
| # | Operation | Lock impact |
|---|---|---|
| 1 | message.create (Message + Mention + Attachment nested) | Channel/User row KEY SHARE |
| 2 | message.update (parent.replyCount++) [reply only] | parent Message row exclusive |
| 3 | channel.update (updatedAt) | Channel row exclusive |
| 4 | channelMember.updateMany (others’ unreadCount++) | multiple ChannelMember rows exclusive ← deadlock vector |
| 5 | channelMember.updateMany (sender unreadCount=0) | sender ChannelMember row exclusive |
#4 is the killer. When users A and B send messages to the same channel concurrently:
Tx-A: UPDATE ChannelMember WHERE channelId=X AND userId != A → locks rows B, C, D, ... one at a time, in scan orderTx-B: UPDATE ChannelMember WHERE channelId=X AND userId != B → locks rows A, C, D, ... one at a time, in scan orderupdateMany is one SQL statement, but with no ORDER BY, Postgres picks lock order based on the plan. Cache state, parallel worker distribution, and table statistics all influence it — meaning the order can change between two concurrent executions of the same SQL.
Direct Evidence From the PG Log
Every deadlock had a different CONTEXT line:
| Time | CONTEXT |
|---|---|
| 05:28:46 | while updating tuple (44,45) |
| 05:28:54 | while updating tuple (105,19) |
| 05:28:55 | while updating tuple (89,28) |
| 05:29:09 | while locking tuple (214,56) |
| 05:29:10 | while locking tuple (1364,5) |
(page, slot) is different every time → lock order is non-deterministic. Hypothesis confirmed.
4. Honest Confession — This Was an Embarrassing AI-Coding Mistake
Let me come clean. This updateMany was generated during AI-assisted coding.
// Intent: "When a message is sent, bump unreadCount by 1 for every other member"await prisma.channelMember.updateMany({ where: { channelId, userId: { not: senderId } }, data: { unreadCount: { increment: 1 } },});Syntactically perfect. Works flawlessly in a single-channel, single-message, single-user test. PR review passed.
But it silently skipped two questions that should have been asked:
-
“Should we really write to N rows on every single message?” — A channel with 200 members means 200 row writes per message. 100 users sending = 20,000 writes/sec. At that volume, RDBMS row writes per message are structurally inefficient.
-
“What happens when two people post to the same channel at the same time?” — That’s the core usage pattern of any messaging app. The AI didn’t think about it. And neither did I when I merged the PR.
This is the AI-coding trap. Code that looks like it works lets you skip thinking about concurrency scenarios. Without the load test, this would have detonated in production the same way.
5. Prescriptions on the Table — How Far Should We Go?
The issue listed three tiers of fixes:
P0 (immediate):
-
Deadlock retry interceptor for
40P01 -
Rewrite
updateManyas raw SQL withORDER BY id FOR UPDATE→ deterministic lock order
P1 (short term):
- Move
unreadCountto Redis HINCRBY, periodically flushed to DB
P2 (medium term):
- Partition Message INSERTs by
channelIdhash
P0 alone makes the deadlock go away. But 1 message = N row writes stays. At 100K CCU, this will explode again — just in a different form.
P1 (Redis) is faster but introduces Redis ↔ Postgres synchronization complexity. unreadCount temporarily diverges from Postgres, and a failed Redis flush can permanently skew the count.
So we chose a different direction.
6. What We Picked — The lastReadAt Column
Core idea:
“Don’t write a counter on every message. Compute the count when you read.”
Drop the ChannelMember.unreadCount column. Replace it with a single ChannelMember.lastReadAt timestamp.
Before — write-heavy
[Send 1 message]  ├─ INSERT Message                              (write 1)  ├─ UPDATE ChannelMember unreadCount++ for N    (write N) ← deadlock vector  └─ UPDATE ChannelMember unreadCount=0 (sender) (write 1)
→ 1 message = (N+2) writes
After — read-on-demand
[Send 1 message]  └─ INSERT Message                              (write 1)                                                          ← done.
[Fetch channel list]  └─ SELECT count(*) FROM Message       WHERE channelId = $1 AND createdAt > lastReadAt   (read, hits index)
[Enter channel / mark as read]  └─ UPDATE ChannelMember SET lastReadAt = NOW()       WHERE userId = \(1 AND channelId = \)2              (write 1, own row only)
Why This Kills the Deadlock
updateMany WHERE userId != sender disappears. Sending a message no longer touches other users’ rows. The lock-contention vector is removed from the code entirely.
lastReadAt updates only touch your own row. User A only ever updates A’s ChannelMember row, user B only B’s. There is no scenario where two transactions compete for the same row — it’s eliminated by construction, not by retry logic.
Why This Isn’t a Performance Regression
At first glance, “running count(*) every time” sounds slower. It isn’t, because:
-
Reads are cache-friendly. With a composite index on
(channelId, createdAt), the count becomes an index range scan. -
Read frequency << write frequency. Users see the channel list when they open the app or enter a channel. Messages are sent dozens to hundreds of times per second. Moving N writes → 1 read is an enormous win on its own.
-
Reads can be served from a read replica. Write locks cannot.
Sequence Diagram (Conceptual)
[Before — count at write time]User A ─── POST /messages ───▶ Web                                 ├─ INSERT Message                                 ├─ UPDATE ChannelMember(N rows) ← 💥 deadlock                                 └─ 200 OK
[After — count at read time]User A ─── POST /messages ───▶ Web                                 ├─ INSERT Message                                 └─ 200 OK                       ← done
User B ─── GET /channels  ───▶ Web                                 ├─ SELECT channels ...                                 ├─ SELECT count(*) FROM Message                                 │    WHERE createdAt > lastReadAt                                 └─ [{ id, name, unread: 3 }, ...]
User B ─── POST /channels/X/read ▶ Web                                 └─ UPDATE ChannelMember                                      SET lastReadAt = NOW()                                      WHERE userId = B           ← own row only
7. Migration — Switching Reads, Removing Bulk Writes, and Cleaning Up the Column
The final direction was to calculate unread counts from the read timestamp and remove the old counter, rather than keep writing unreadCount. The actual work separated the read-path switch from write removal.
| Phase | Change | Relationship to counter writes and the deadlock |
|---|---|---|
| Phase 1 — switch reads | Add lastReadAt, backfill the read position, and return a calculated unreadCount through the API | Keep existing writes temporarily for comparison. This phase alone does not remove the deadlock cause. |
| Phase 2 — remove bulk writes | Remove the increment function and send-time calls, plus the decrement query on message deletion | Remove the counter-update path that touched multiple member rows. |
| Phase 3 — clean up references and column | Convert remaining references, including dashboard aggregation, then remove the DB column | Schema cleanup after removing the offending queries. The API response field stays. |
Phase 1 corresponds to PR #836, merged on May 8, 2026. Writes remained temporarily so the new calculated values could be compared against the existing counter. This transition was not the final design.
Phase 2 corresponds to PR #974, merged on May 20, 2026. It removed updateUnreadCounts() and its message-send call, along with the updateMany that decremented unreadCount on message deletion. The deadlock path disappeared when these bulk writes were removed, not when the read results changed.
Dropping the column was a separate step. Dashboard aggregation and read handling still referenced it after Phase 2, so those references were cleaned up before removal. The final issue record notes that the production DB update and main deployment were complete.
Separating verified results from validation targets
PR #974 records a PostgreSQL 40P01 count of 0 during the staging load test. However, recovering 75 TPS and keeping HTTP errors below 1% were validation targets; the PR did not provide completed measurements of them. This article therefore does not claim those figures as achieved results.
NOTE
Correction from October 18, 2026, aligned with the Korean article: the related issues and merged PRs distinguish the read-path transition from the later removal of bulk writes. Switching only the read API did not remove the deadlock cause. The write-removal work took place after the original publication date.
Follow-up: Moving FCM Delivery to a Worker Queue
While diagnosing the deadlock, I also found another responsibility in the same message-send handler. POST /messages and POST /dm/:userId/messages launched FCM push work directly in the response path, while empty .catch(() => {}) blocks hid failures. This section consolidates the previously separate account of that FCM work.
The actual failure in the preceding load test was the DB deadlock, and the connection pool was not saturated at the time. Moving push work was a follow-up improvement addressing resource contention as fan-out and concurrency grew, together with an observability gap. It does not change the cause of the measured HTTP errors.
Work that keeps using the same process and pool after the response
Sending a push involved more than an FCM HTTP call:
inside sendPushToUser ├─ query pushDevice (Postgres) ├─ query presence (Redis) ├─ query userPreference (Postgres) ├─ FCM HTTP send (Firebase Admin) └─ clean up invalid tokens (Postgres)This work shared the same Prisma connection pool in the same API server process as message persistence. sendPushToUser(...).catch(() => {}) was a floating promise: it was neither awaited nor returned to the caller. It continued using DB and Redis resources after HTTP 201. Not waiting for it did not separate its resources from request processing.
One message can fan out to N recipients and create more push work. Handling FCM latency and partial outages in the request process can therefore contend with message-save queries. The original account used an additional 100ms of Firebase latency as an illustration of that exposure, not as a measured result.
The API enqueues; the worker owns lookup, delivery, and failures
I moved FCM calls into a dedicated BullMQ worker queue and reduced the API’s responsibility:
// response path: delegate only "who gets what" to the queue, then respond immediatelyawait pushQueue.add("send-push", { recipientIds, payload, event });// → HTTP 201The API guarantees that the push task was enqueued, not that delivery completed. A separate worker process owns the following work:
| Worker responsibility | Details |
|---|---|
| Target lookup | pushDevice / presence / userPreference |
| Batch delivery | FCM multicast, up to 500 tokens per call |
| Failure handling | retries and exponential backoff for errors such as server-unavailable |
| Token cleanup | deactivate UNREGISTERED or invalid tokens |
| Stability | concurrency limits and failed-job recording (DLQ) |
| Observability | push-specific metrics and structured logging |
This separated the process responsibilities for message persistence and external I/O. The queue coordinated recipients, payloads, and failure handling, while FCM/APNs remained the final delivery network. A queue alone does not guarantee final delivery or isolation from every failure, so enqueue failures and failures inside the worker still needed separate observation.
Replacing empty catches with structured logging and Sentry
I replaced empty catch blocks scattered across channel and DM notifications with an observability helper. Previously, FCM and realtime-notification failures disappeared without a signal reaching operators. The changes were:
- Record rejected promises and push
success = falsethroughsecureLogger.error. - Record partial FCM failures (
failureCount > 0) throughsecureLogger.warn, including cases where only some tokens fail. - Return a push failure when Firebase Admin is not configured in production, rather than silently skipping delivery.
- Attach project, app, screen, and route tags plus request context in Sentry, group matching errors into Issues, and connect thresholds to Telegram alerts and GitHub Issue automation.
try { await runImportantAction();} catch (error) { Sentry.withScope((scope) => { scope.setLevel('error'); scope.setTag('screen_name', screenName); scope.setTag('route', route); scope.setContext('request', { method, endpoint, http_status, duration_ms }); Sentry.captureException(error); });}Enqueuing in the response path can fail too. I recorded that failure through a separate log and metric rather than swallowing it:
enqueuePush(...).catch((err) => { secureLogger.error("push enqueue failed", err, { operation: "push.enqueue", messageId, event }); metrics.increment("push_enqueue_failed");});The changes established a separate path for push I/O and turned previously hidden failures into searchable, alertable signals. The original record did not include separate measurements of push delivery rates or TPS gains, so I have not added any. Removing the empty catches and moving responsibility to a worker were both necessary.
Conclusion
This incident wasn’t a one-line bug. It was a thinking-pattern trap.
-
The AI-generated
updateManyis a correct answer to “How do I express this in Prisma syntax?” -
It is not an answer to “In a messaging app, how does this SQL acquire locks when two users post to the same channel simultaneously?” Because nobody asked that question.
-
The faster AI-generated code lands, the more human review of concurrency, isolation, and scalability matters. That’s the actual value of a PR review.
The FCM follow-up applied the same responsibility boundary by separating external I/O and making failures observable.
One more lesson. Load testing belongs before production, not after. Without an isolated load-test environment, this would have detonated under 100K CCU traffic. We’d have been chasing a 5xx storm caused by deadlock cycles in production. The environment itself prevented one incident.
Comments